With everything that Nutriscore is talking about and with the doubts that some of us have regarding its usefulness (see), it is normal that we pay attention to scientific publications about this system. And just a few days ago we met a new one, «The Impact of the Nutri-Score Front-Pack Nutrition Label on Purchase Intentions for Processed and Unprocessed Foods: Post Hoc Analysis of Three Randomized Controlled Trials» (2021).
After these points, let’s get to the point.
«These findings provide new insights into the positive effect of Nutriscore, which appears to decrease the purchase of processed products, resulting in a higher proportion of unprocessed and unpackaged foods, in line with public health recommendations.»
But I am not going to focus on this result. I prefer to delve into other data related to the purpose for which Nutriscore was created: to help us choose «better» packaged products through its letter and color evaluation system. Because it is worth remembering that Nutriscore only applies to processed and packaged products and that this label was created precisely to provide us with information that encourages us to buy (and consume) more products qualified with level A and B (healthier according to their algorithm) and less. with level D and E (less healthy). It is assumed that it is its added value compared to other labels, such as the alert type (high in salt, high in sugar, etc.), which only provide negative evaluations.
«…there were no significant differences between the Nutri-Score and unlabeled groups»
Well, after doing the numbers I have graphically represented the result. Bars with solid lines show the percentage of packaged products purchased that would fit into each Nutriscore level when no FOPL tag is used, regarding the total number of packaged products. And the bars with dashed lines show the same thing, but in this case when using the Nutriscore label:
It can be seen that the percentage of A and B – the products classified as healthier – has been reduced, just the opposite of what would be desirable (and expected by Nutriscore defenders). On the contrary, the percentage of D has increased, which is positive, but that of E – the least healthy group – has practically not changed. Finally, the C percentage – an «intermediate» level that is not known to be healthy or not but that I personally consider is nothing to write home about – has increased significantly.
In short, according to this data it seems that Nutriscore has not served to buy better packaged or processed products. The percentage distribution with a dashed line (with Nutriscore) is not significantly better than the percentage distribution with a solid line (without labels).
Regarding the influence on unpackaged products
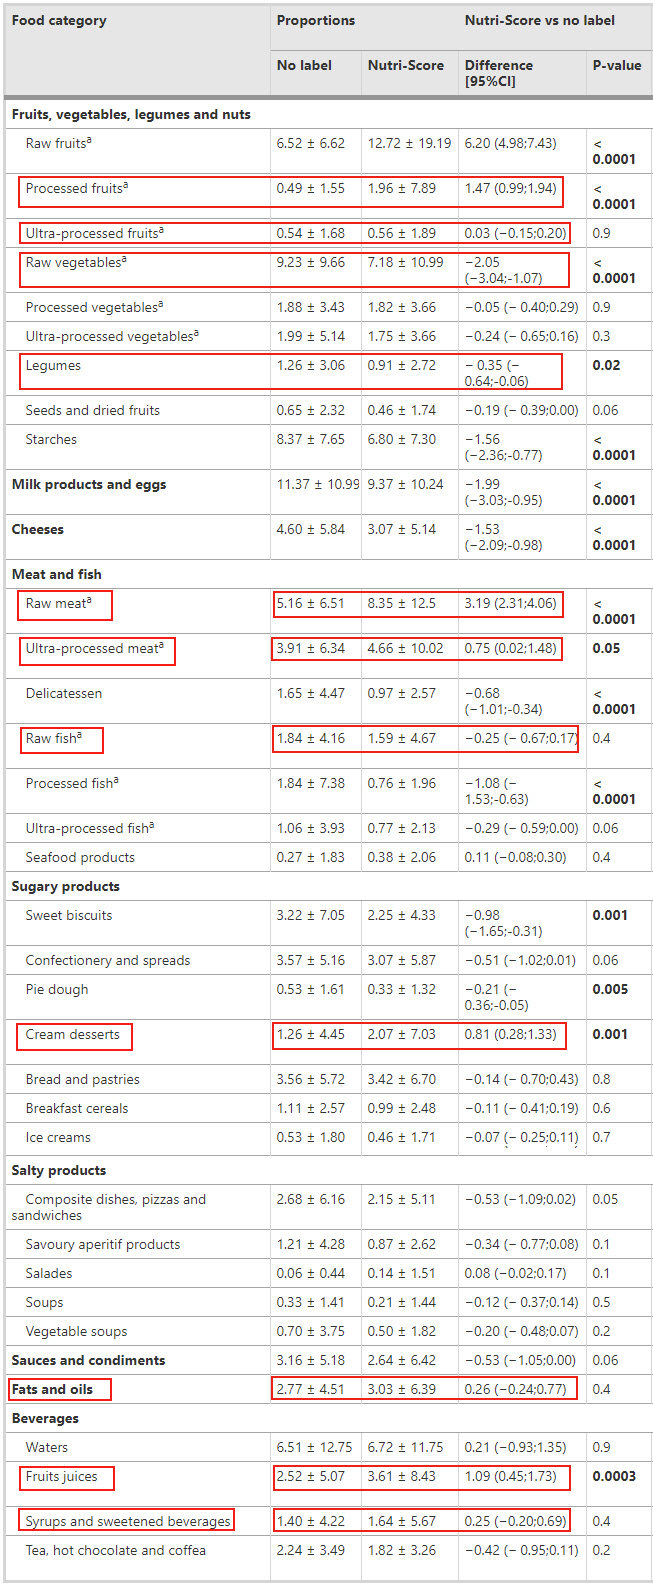
Let’s return to the main objective of the article, to analyze the influence of the Nutriscore label on the purchase of unpackaged products. As I have already mentioned, this result is positive, as shown in the following table included:
I have framed in green, at the bottom of the table, the result that has given rise to the main conclusions highlighted by the authors: the percentage of non-packaged products purchased has increased by almost 6%. In principle it is a good result, although quite modest.
But it is also worth clarifying that if instead of the percentage of products we look at the number, We will see that, paradoxically, the number of unpackaged products has actually been reduced with Nutriscore. About 2%, as framed in red. But since the number of products has been reduced in all cases, the overall balance in percentage has been positive.
I have marked in red the differences that can be considered negative (because the proportion of products has changed for the worse when using Nutriscore labeling) and there are a few. Certainly, the rest of the results are mostly positive, but there are some of the framed ones that are quite worrying: Reduction in the purchase of vegetables, legumes and fresh fish. And increase in fresh and processed meat, as well as juices and sugary drinks. None of these dietary changes can be considered positive, quite the opposite.
Conclusions
In short, in this study, on the one hand, it seems that Nutriscore helps to slightly increase the purchase of unpackaged or fresh products. Also to reduce some not recommended and increase some healthy ones. But on the other hand, it also seems to cause other undesirable dietary changes.. Furthermore, it can be deduced from the data included that Nutriscore has not been effective in helping people purchase better packaged products, which It should be its primary function.
Therefore, I think that this study adds little in favor of Nutriscore. YesYour design – a computer simulation – is unrealistic; and its results – diverse and heterogeneous – are not at all conclusive regarding its real usefulness or possible benefits.
Update:


